<?xml version="1.0" encoding="utf-8"?><feed xmlns="http://www.w3.org/2005/Atom" ><generator uri="https://jekyllrb.com/" version="4.4.1">Jekyll</generator><link href="https://beamsift.com/feed.xml" rel="self" type="application/atom+xml" /><link href="https://beamsift.com/" rel="alternate" type="text/html" /><updated>2026-10-13T22:04:51+00:00</updated><id>https://beamsift.com/feed.xml</id><title type="html">BeamSift Labs</title><subtitle>Connectivity intelligence for enterprise Wi-Fi network operations.</subtitle><entry><title type="html">Why Wi-Fi metric definitions matter</title><link href="https://beamsift.com/blog/2026/03/31/why-wifi-metric-definitions-matter.html" rel="alternate" type="text/html" title="Why Wi-Fi metric definitions matter" /><published>2026-03-31T00:00:00+00:00</published><updated>2026-03-31T00:00:00+00:00</updated><id>https://beamsift.com/blog/2026/03/31/why-wifi-metric-definitions-matter</id><content type="html" xml:base="https://beamsift.com/blog/2026/03/31/why-wifi-metric-definitions-matter.html"><![CDATA[<p><em>Sifting Signals: commentary on using data to reason about Wi-Fi behavior and use cases at scale, whether you are designing features, tuning performance, or debugging issues.</em></p>

<h2 id="overview">Overview</h2>

<p>Earlier articles in this series, <a href="https://beamsift.com/blog/2026/01/08/llm-wifi-support">Part 1</a> and <a href="https://beamsift.com/blog/2026/02/04/llm-wifi-support-part2-more-wifi-data">Part 2</a>, examined how an AI assistant responded to Wi-Fi support telemetry and how additional telemetry could improve that response. This article shifts the focus one step earlier to the Wi-Fi telemetry itself. Using Received Signal Strength Indicator (RSSI) as an example, it shows how the value of a Wi-Fi metric can differ based on how it is measured even when it carries the same name.</p>

<h2 id="1-telemetrys-downstream-uses">1. Telemetry’s downstream uses</h2>

<p><img src="/assets/img/season1-post3/Post3_telemetry_downstream_uses.png" alt="Telemetry downstream uses" width="70%" /></p>

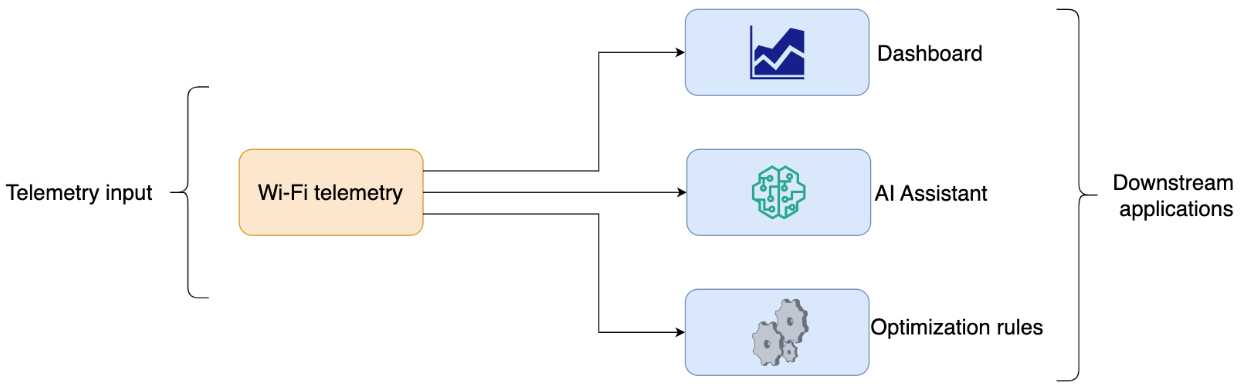
<p>Wi-Fi telemetry can feed several downstream applications. A dashboard can use it to provide quick network insights, a network optimization rule can use it to trigger an action or an AI assistant can use it to explain what is happening in the network. A downstream application typically sees only the provided metric value, not how it was measured. Therefore, it is important to understand what the telemetry value represents before it is used downstream.</p>

<h2 id="2-why-measurement-method-matters">2. Why measurement method matters</h2>

<p>Managed Wi-Fi systems often work with summaries such as averages or percentiles rather than raw samples. This is one practical reason why measurement method matters. Summaries help reduce storage requirements while still retaining useful information for downstream applications. If the values used to compute the aggregate are not measured in the same way, then the aggregate value can shift even though the metric name stays the same. Let’s look at it with RSSI as an example.</p>

<h4 id="a-closer-look-at-rssi-measurements">A closer look at RSSI measurements</h4>

<p>RSSI is commonly used to assess Wi-Fi coverage across the network. However, the reported RSSI value can reflect different underlying measurements.</p>

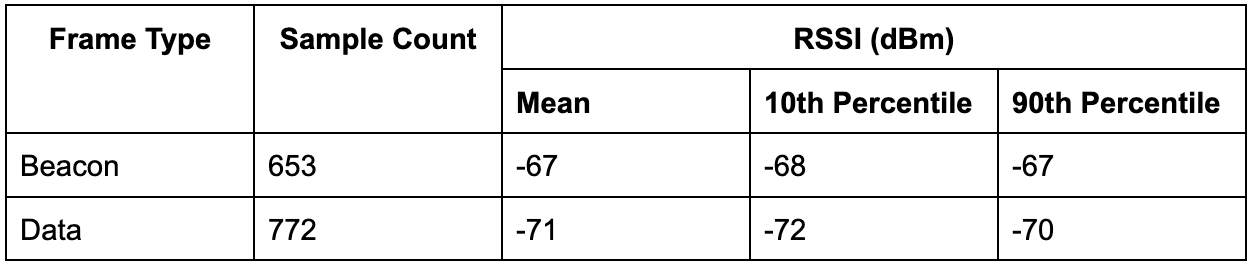
<p>To illustrate this, using the same setup as that described in the previous articles, we look at the RSSI distributions of the beacon frames and data frames captured while downlink traffic was running between the AP and the Wi-Fi client. At the same capture location, the RSSI distributions for the two frame types differ as shown below:</p>

<p><img src="/assets/img/season1-post3/Post3_beacon_vs_data_rssi_distribution.png" alt="Beacon_vs_Data_RSSI_distribution" width="50%" /></p>

<p>Although this example focuses on beacon frames and data frames, RSSI can also be reported from different RF chains, different bandwidths or averaging windows. 
The exact RSSI delta can vary depending on the measurement method, but the main point is that both rows above are valid RSSI measurements even though the values differ by a few dB. If these are combined into a single summary, the aggregate can influence downstream interpretation. For example, it can make coverage appear better or worse than it would under a different measurement method. The summary can shift further if invalid RSSI samples are included in the aggregate rather than filtered out first.</p>

<h2 id="3-conclusion">3. Conclusion</h2>
<p>Production systems generally rely on summaries, and it is appropriate to do so. In the RSSI example, it is useful to keep separate summaries for different frame types and to know which one is used downstream. Aggregation choices like these depend on how the metric is measured, so what is appropriate for RSSI will be different from that for channel utilization or PHY rate. Without guardrails and well-defined aggregation criteria, downstream applications can end up using misleading inputs.</p>

<p><em>If your team is working through similar telemetry or aggregation questions for your Wi-Fi system, feel free to reach out.</em></p>]]></content><author><name></name></author><category term="blog" /><category term="wifi" /><category term="ai" /><category term="llm" /><category term="support" /><category term="metric" /><summary type="html"><![CDATA[Sifting Signals: commentary on using data to reason about Wi-Fi behavior and use cases at scale, whether you are designing features, tuning performance, or debugging issues.]]></summary></entry><entry><title type="html">LLMs for Wi-Fi Support - Part 2: What Changes When the AI Assistant Has Access to More Wi-Fi Data?</title><link href="https://beamsift.com/blog/2026/02/04/llm-wifi-support-part2-more-wifi-data.html" rel="alternate" type="text/html" title="LLMs for Wi-Fi Support - Part 2: What Changes When the AI Assistant Has Access to More Wi-Fi Data?" /><published>2026-02-04T00:00:00+00:00</published><updated>2026-02-04T00:00:00+00:00</updated><id>https://beamsift.com/blog/2026/02/04/llm-wifi-support-part2-more-wifi-data</id><content type="html" xml:base="https://beamsift.com/blog/2026/02/04/llm-wifi-support-part2-more-wifi-data.html"><![CDATA[<p><em>Sifting Signals: commentary on using data to reason about Wi-Fi behavior and use cases at scale, whether you are designing features, tuning performance, or debugging issues.</em></p>

<h2 id="summary">Summary</h2>
<p>In the previous article, we looked at a familiar user complaint - ‘Connection ‘feels’ very fast in the living room where the router is located but in the office, the video calls and browsing ‘feel’ slow’ - and examined how an off-the-shelf large language model (LLM) behaved when given the client-side logs (RSSI, noise, SNR, Tx PHY rate, channel, RTT, location). The AI assistant could identify broad Wi-Fi changes between the two locations (drop in signal strength, lower PHY rates) but introduced “interference” as a likely cause without any notion of how busy the wireless medium was. If you haven’t already read the previous article, you can find it here: <a href="https://beamsift.com/blog/2026/01/08/llm-wifi-support">Part 1</a></p>

<p>This article adds ‘channel utilization’ as a way to estimate how busy the wireless medium looks during the user’s session. Using the same two room setup and data as before, we compare three cases:</p>

<ul>
  <li>No channel utilization input</li>
  <li>Quiet channel</li>
  <li>Busier channel</li>
</ul>

<p>These examples use illustrative utilization values (15% as “low” and “45%” as “busier”) from the AP’s point of view rather than measured numbers. We then look at how the AI assistant’s responses change in each case and qualitatively assess whether the causes and next steps stay grounded in the available evidence, and where they still fall short.</p>

<p>The main takeaway is that giving the assistant ‘utilization’ information helps it reason about the causes of the complaint more concretely. At the same time, when utilization looks similar in both rooms, it tends to de-prioritize interference. In real networks, weak coverage can hurt more when the channel is busy than when it is quiet. An AI-enabled Wi-Fi system should consider utilization and coverage as interdependent factors to arrive at a reasonable explanation.</p>

<h2 id="1-recap-user-complaint-and-setup">1. Recap: User Complaint and Setup</h2>
<p>Using a simple example, the previous article looked at the assistant’s behavior to extract meaningful lessons.</p>

<ul>
  <li>User complaint: Connection ‘feels’ very fast in the living room where the router is located but in the office, the video calls and browsing ‘feel’ slow.</li>
  <li>Setup: The router is located in the living room while the office room is farther away.</li>
  <li>Per-second client-side logs: RSSI, noise, SNR, Tx PHY rate, channel, LAN/WAN RTT, location.</li>
</ul>

<p>In the previous article, we saw that the LLM correctly identified broad patterns such as the office had weaker signal and lower Tx PHY rate but still came up with “interference” as one of the likely causes without any data about interfering sources or the extent of interference. In this part, we provide the assistant with an additional piece of information about the ‘busyness’ of the wireless medium.</p>

<h2 id="2-interpreting-interference">2. Interpreting ‘interference’</h2>
<p>In this article, we use ‘interference’ to mean ‘medium busyness’ that reduces available airtime due to activity on the channel (Wi-Fi contention and/or non-Wi-Fi energy).</p>

<p>Typically, a Wi-Fi system can estimate this ‘medium busyness’ per radio/interface using:</p>

<h4 id="clear-channel-assessment-cca-counters-on-the-wi-fi-chipset">Clear Channel Assessment (CCA) counters on the Wi-Fi chipset:</h4>
<p>Chipset vendors often expose internal counters that track how long the Clear Channel Assessment indicates the medium as busy over a time window. From these, a device (AP or client) can derive the fraction of time the medium was busy. Depending on implementation, these counters may include the time spent by the device’s own traffic as well as other energy (Wi-Fi or non-Wi-Fi) on the channel.</p>

<h4 id="bss-load-indicator">BSS Load indicator:</h4>
<p>Some access points advertise the channel utilization they observe in beacons and probe response frames using the BSS Load information element (IE). It provides an insight into the AP’s view of channel busy time.</p>

<p>In a real system, ‘channel utilization’ can come from an AP or a client using their respective counters. Each device presents its perspective of medium busyness, based on where it is located and its own hardware implementation. Understanding which implementation your system uses, whether it separates one’s own airtime from other busy time, and whether the value makes sense is important if you plan to feed it as input to an AI assistant.</p>

<p>In this article, we do not focus on the specifics of each implementation. Instead, for simplicity, we use utilization as a coarse indicator of medium busyness during the user’s video call/browsing session.</p>

<h2 id="3-system-view-adding-a-busyness-input">3. System View: Adding a ‘busyness’ input</h2>

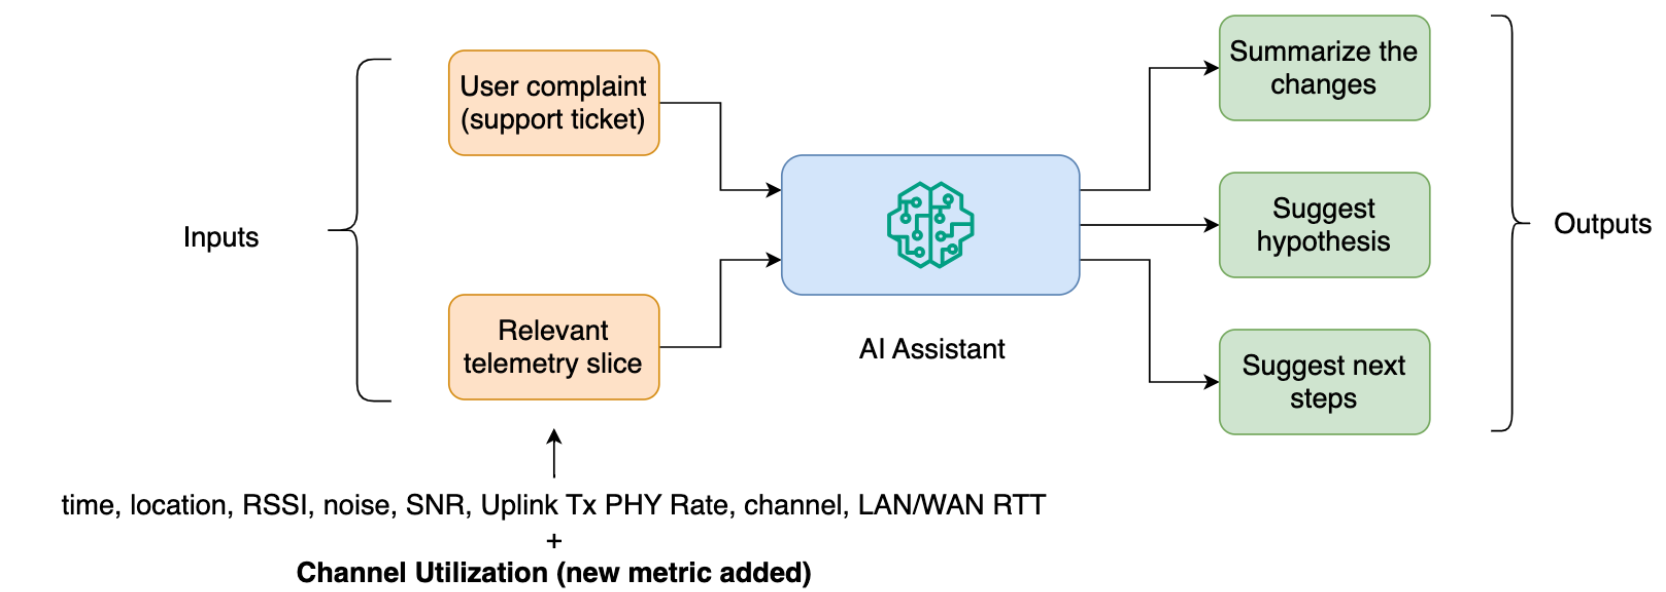
<p>At a high level, the system still follows the conceptual workflow from the previous article where the AI assistant is given the ‘user complaint’ and the relevant telemetry slice consisting of time, location, RSSI, noise, SNR, uplink Tx PHY rate, channel, LAN/WAN RTT. Here, the only change is the addition of a ‘channel utilization’ field as input, which reflects how busy the channel looked during the session.</p>

<p><img src="/assets/img/season1-post2/System_view.png" alt="System view" width="70%" /></p>

<p>In the examples that follow, we look at hypothetical utilization values (15% and 45%) that represent lower and higher levels of medium busyness.</p>

<h2 id="4-ai-assistant-setup-changes">4. AI assistant setup changes</h2>
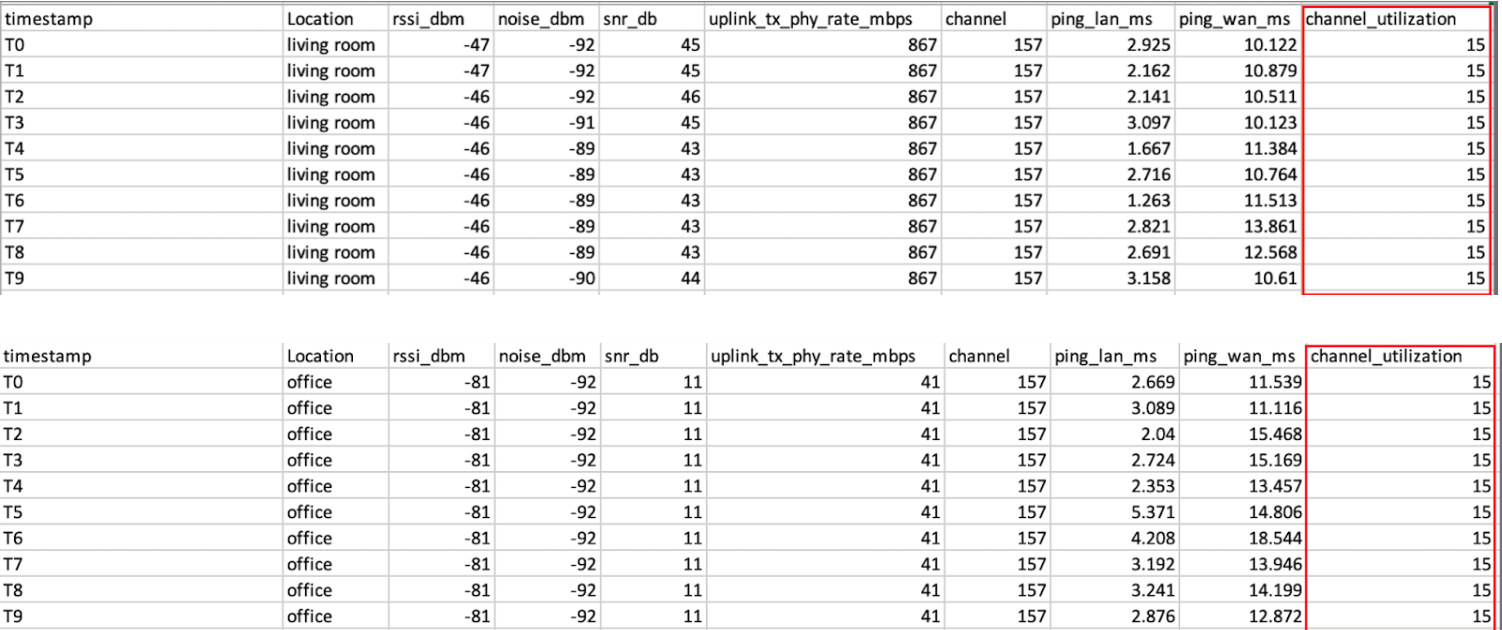
<p>We keep the same two room setup, telemetry and model (“gpt-4.1-mini”). The physical setup still consists of a single AP in the living room. The channel utilization is represented as a single value shared by both locations (living room and office) over the entire user session, rather than a per room measurement. The assistant still has to describe changes between the two rooms, suggest likely Wi-Fi causes and propose safe next steps for a home user.</p>

<p>The assistant behavior is illustrated with two changes:</p>

<h4 id="prompt-tweak">Prompt tweak:</h4>
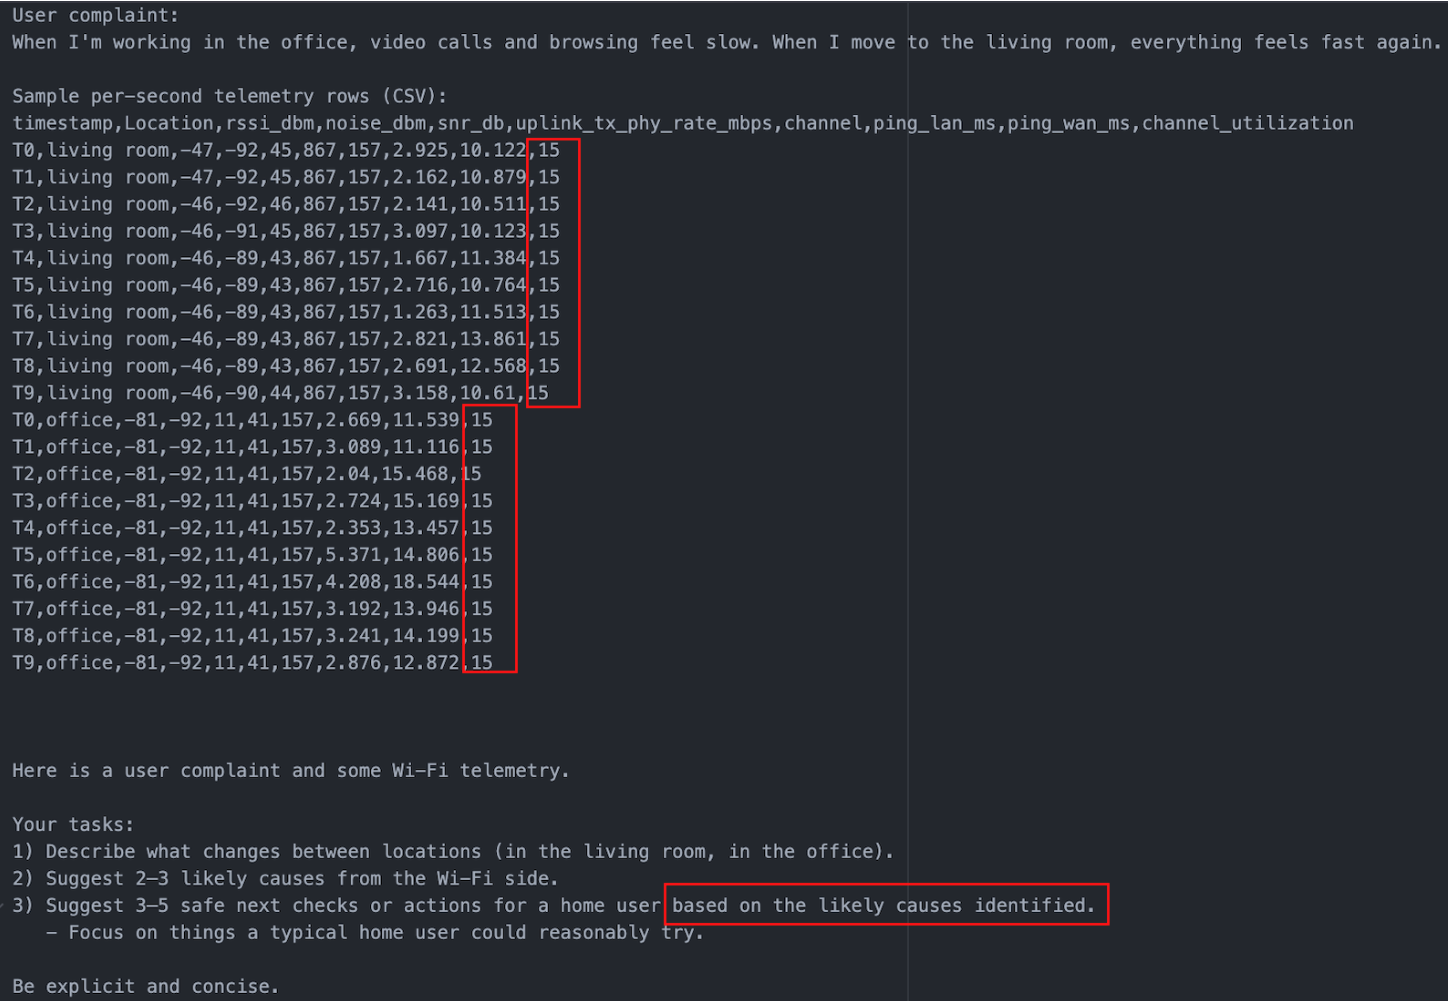
<p>A small guardrail is added to the prompt so that the suggested next steps are tied to its own reasoning. Specifically, the line now reads as “Suggest 3-5 safe next checks or actions for a home user based on the likely causes identified.”</p>

<h4 id="utilization-column-variants">Utilization column variants:</h4>
<p>The per-second telemetry table is extended by adding a ‘channel utilization’ column. Three input variants are constructed from the same logs using hypothetical but plausible utilization values:</p>

<ul>
  <li>No utilization metric
    <ul>
      <li>The table is exactly as in the previous article. No ‘channel utilization’ column</li>
    </ul>
  </li>
  <li>Quiet channel (15%)
    <ul>
      <li>The table now has a ‘channel utilization’ column set to 15% for every row in both the living room and the office (snapshot below).</li>
    </ul>
  </li>
  <li>Busier channel (45%)
    <ul>
      <li>The ‘channel utilization’ column is set to 45% for every row (also, same for both locations).</li>
    </ul>
  </li>
</ul>

<p><img src="/assets/img/season1-post2/additional_column_example.png" alt="" width="70%" /></p>

<p>The example snapshot below shows the additional channel utilization column for the ‘quiet’ channel scenario and the prompt tweak as an input to the LLM.</p>

<p><img src="/assets/img/season1-post2/LLM_input_with_changes.png" alt="" width="85%" /></p>

<h2 id="5-results-how-the-assistant-reacts-to-utilization">5. Results: how the assistant reacts to utilization</h2>

<p>The three input variants change the assistant’s behavior as shown below:</p>

<h3 id="51-no-channel-utilization-column">5.1 No channel utilization column:</h3>

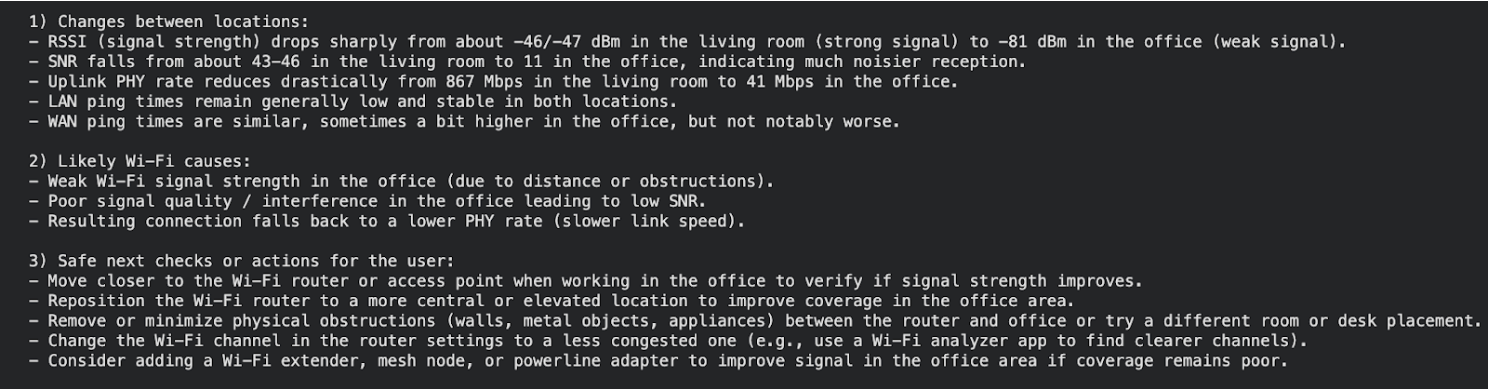
<p><img src="/assets/img/season1-post2/LLM_no_util_resp.png" alt="" width="85%" /></p>

<ul>
  <li>As in Part 1, the assistant correctly identifies that RSSI/SNR/Uplink Tx PHY rates are much worse in the office than in the living room. However, it lists ‘interference’ as a likely cause without supporting evidence.</li>
  <li>In this example, it still provides channel change recommendations based on an unsupported ‘interference’ cause, despite adding the prompt guardrail (‘suggest next steps based on the likely causes identified’).</li>
</ul>

<h3 id="52-channel-utilization-is-low-15-and-set-to-the-same-value-for-both-locations">5.2 Channel utilization is low (15%) and set to the same value for both locations</h3>

<p><img src="/assets/img/season1-post2/LLM_low_util_resp.png" alt="" width="85%" /></p>

<ul>
  <li>As in the previous case, the assistant still identifies coverage issues (weak signal, low SNR, low PHY rate) as the main difference between rooms.</li>
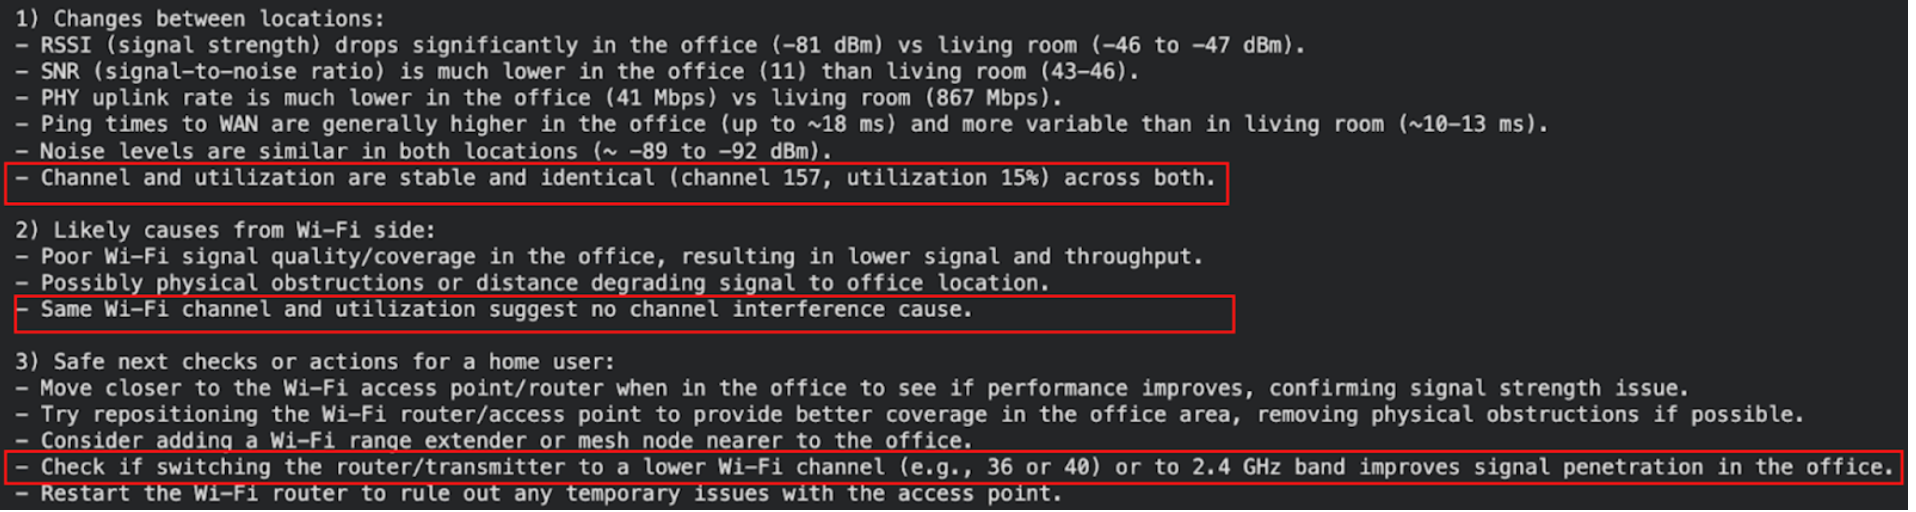
  <li>With the new metric, it explicitly notes that channel and utilization values are the same for both locations and uses that to say channel interference is not a likely cause.</li>
  <li>Coverage driven actions (moving closer to the router, repositioning the router, reducing physical obstructions, adding an extender) stay, but now the assistant also focuses on improving range (e.g. switching to a lower 5 GHz channel or the 2.4 GHz band) rather than reducing interference.</li>
</ul>

<h3 id="53-channel-utilization-is-higher-45-and-set-to-the-same-value-for-both-locations">5.3 Channel utilization is higher (45%) and set to the same value for both locations</h3>

<p><img src="/assets/img/season1-post2/LLM_high_util_resp.png" alt="" width="85%" /></p>

<ul>
  <li>Weaker coverage in the office is highlighted again as a primary issue.</li>
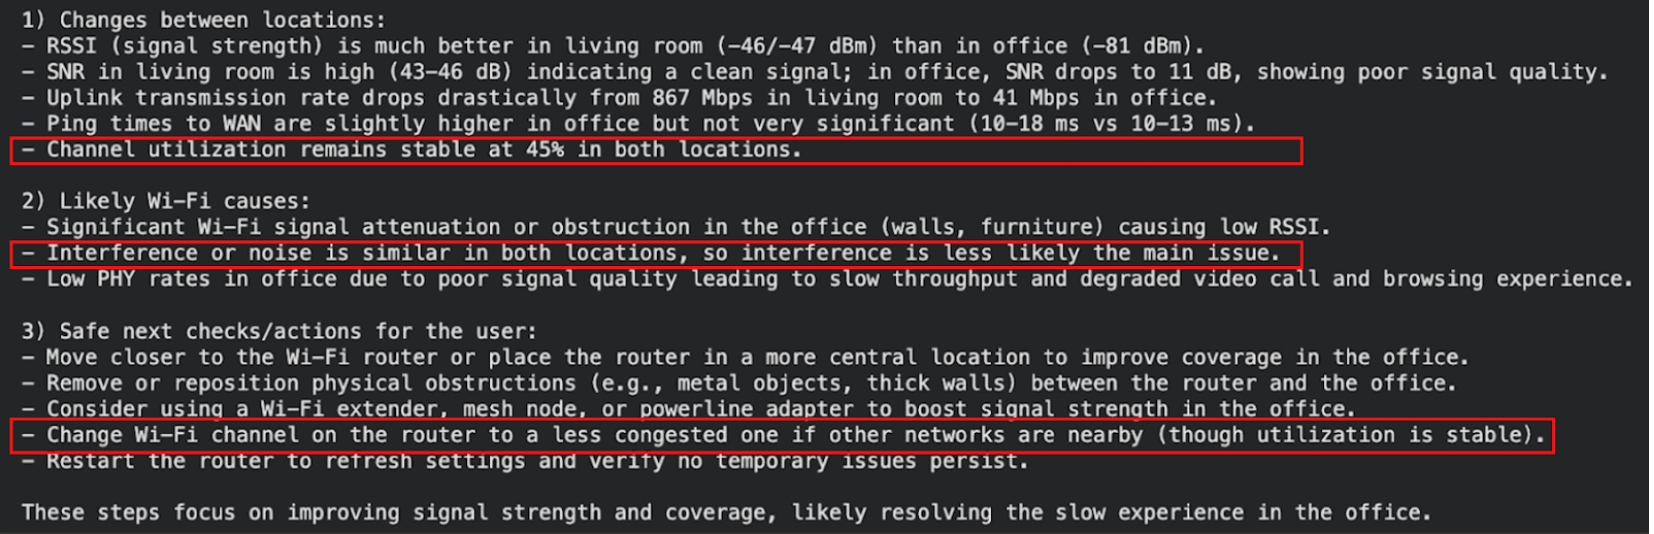
  <li>Even though the channel utilization is higher (45%) in this case, the model uses the same utilization value for both locations to say ‘interference’ is ‘less likely the main issue’ behind why video calls and browsing feel slower in the office than in the living room.</li>
  <li>Recommendations are similar to the previous case but with higher utilization the assistant also suggests changing to a less congested channel as a secondary mitigation.</li>
</ul>

<h2 id="6-analysis-what-a-simple-prompt-change-and-utilization-metric-accomplished">6. Analysis: what a simple prompt change and utilization metric accomplished</h2>

<p>In our basic AI system, the prompt tweak  (“suggest next steps based on the likely causes identified”) encourages the assistant to suggest actions related to stated causes but it cannot repair a hypothesis that was never based on evidence to begin with.</p>

<p>What the utilization metric changes:</p>
<ul>
  <li>when utilization is low, the assistant prioritizes coverage as a cause for why the office feels ‘slow’</li>
  <li>when utilization is higher, the assistant still highlights coverage as the main problem, with channel change appearing as a secondary next step</li>
  <li>different utilization levels steer which next steps are suggested (eg., whether to bring up channel change at all)</li>
</ul>

<p>Some suggestions (eg., switching to a lower 5 GHz channel or the 2.4 GHz band) require engineering judgement before recommending. Lower 5 GHz typically offers minimal range benefit over a high 5 GHz channel, and 2.4 GHz range gains often come with tradeoffs (narrower channel widths, more congestion/interference).</p>

<p>Finally, even though we have managed to improve our AI system, it still fails to capture the nuance that the performance can be degraded by multiple factors operating jointly. In a Wi-Fi system, coverage issues can be worsened by congestion. For example, a weak link falls back to lower PHY rates, spends more time on air (see appendix), and therefore suffers more from contention when the channel is busy. A single utilization value applied to both rooms does not make interference harmless. A production system design should accommodate these interdependent factors to be useful in the field.</p>

<h2 id="7-conclusion">7. Conclusion</h2>

<p>The two room coverage complaint, revisited with a channel utilization metric, surfaced a few general lessons for building an AI-enabled Wi-Fi system:</p>
<ul>
  <li>prompt changes without the right metrics cannot make up for missing, incomplete, or inaccurate evidence</li>
  <li>additional metrics (like channel utilization) can help constrain when the assistant brings up a cause (like interference or congestion), instead of using it as a generic explanation</li>
  <li>a reliable system requires understanding how different Wi-Fi factors interact, for example, weak signal and congestion can degrade performance together</li>
  <li>some suggestions still require engineering judgement before recommending to the end user (for example, switching to a lower 5 GHz channel or the 2.4 GHz band)</li>
</ul>

<p>If you’d like to discuss how to choose and validate the right metrics, and design AI-enabled Wi-Fi systems that use them reliably, feel free to reach out.</p>

<h2 id="8-appendix">8. Appendix</h2>

<p>In order to get insight into how airtime increases at lower rates, let’s consider a simple example and calculate the time on air for a 1500 byte packet.</p>

<ul>
  <li>In the living room, the link supports a PHY rate of 867 Mbps. A 1500 byte packet would then require:</li>
</ul>

<div class="equation" role="math" aria-label="1500 times 8 bits divided by 867 megabits per second equals 13.84 microseconds, approximately 14 microseconds on the wireless medium">
  <span class="fraction"><span>1500 × 8 bits</span><span>867 Mb/s</span></span>
  <span>= 13.84 μs ≈ 14 μs</span>
  <span class="equation-note">on the wireless medium</span>
</div>

<ul>
  <li>In the office room, the link supports a PHY rate of 41 Mbps. A 1500 byte packet would then require:</li>
</ul>

<div class="equation" role="math" aria-label="1500 times 8 bits divided by 41 megabits per second equals 292.68 microseconds, approximately 300 microseconds on the wireless medium">
  <span class="fraction"><span>1500 × 8 bits</span><span>41 Mb/s</span></span>
  <span>= 292.68 μs ≈ 300 μs</span>
  <span class="equation-note">on the wireless medium</span>
</div>

<p>In reality, the time required for the successful delivery of a packet is higher than that required for just the payload due to protocol overheads (PHY/MAC headers), contention/backoffs, acknowledgements, and retransmissions. However, this simple example helps illustrate the fact that, in our setup, the data transmission for the same application payload takes more than 20x longer at the office link rate than in the living room.</p>]]></content><author><name></name></author><category term="blog" /><category term="wifi" /><category term="ai" /><category term="llm" /><category term="support" /><summary type="html"><![CDATA[Sifting Signals: commentary on using data to reason about Wi-Fi behavior and use cases at scale, whether you are designing features, tuning performance, or debugging issues.]]></summary></entry><entry><title type="html">Can AI Actually Help With a Common Wi-Fi Complaint? A Look at LLMs for Support</title><link href="https://beamsift.com/blog/2026/01/08/llm-wifi-support.html" rel="alternate" type="text/html" title="Can AI Actually Help With a Common Wi-Fi Complaint? A Look at LLMs for Support" /><published>2026-01-08T00:00:00+00:00</published><updated>2026-01-08T00:00:00+00:00</updated><id>https://beamsift.com/blog/2026/01/08/llm-wifi-support</id><content type="html" xml:base="https://beamsift.com/blog/2026/01/08/llm-wifi-support.html"><![CDATA[<p><em>Sifting Signals: commentary on using data to reason about Wi-Fi behavior and use cases at scale, whether you are designing features, tuning performance, or debugging issues.</em></p>

<h2 id="summary">Summary:</h2>
<p>With all the attention surrounding AI over the past few years, an often repeated question in my discussions has been some version of: <em>“What possibilities can be unlocked with AI for Wi-Fi networks?”</em></p>

<p>Wi-Fi chipset vendors are already building AI-driven features for optimizing performance for the Wi-Fi client. However, this article looks at the support side of the problem: how a general purpose large language model (LLM) could help with Wi-Fi support, using a common and relatable poor Wi-Fi coverage complaint as an example. I hope you find value in this insight.</p>

<p>Using a basic setup, the article:</p>
<ul>
  <li>describes the user complaint</li>
  <li>explains the physical setup and the telemetry data collected for this scenario</li>
  <li>provides a high-level view of the system</li>
  <li>describes the AI assistant setup</li>
  <li>scrutinizes the AI assistant’s response when given the field data, and</li>
  <li>qualitatively analyzes the AI assistant’s strengths and weaknesses</li>
</ul>

<p>The example doesn’t span the entire real problem space, but it is simple enough to understand in detail and real enough to extract meaningful lessons. The main takeaway is that, in this simple setup, an off-the-shelf LLM can extract some broad patterns from the data but without the right data or guardrails it can speculate about causes, which can mislead end users. Real field issues and production systems are more complex, and any takeaways here need careful system design before they are applied more broadly.</p>

<h2 id="1-problem">1. Problem</h2>
<p>To make this tangible, I picked a familiar complaint: <em>Connection ‘feels’ very fast in the living room where the router is located but in the office room, the video calls and browsing ‘feel’ slow.</em>
This article focuses on this one simple incident and asks: can a simple AI assistant help with it, and if so, to what extent?</p>

<h2 id="2-setup--data-collection">2. Setup &amp; data collection</h2>
<h3 id="setup">Setup</h3>
<p>The setup is simple: a retail dual-band (2.4 GHz /5 GHz) Wi-Fi 5 router and a MacBook client used at two locations:</p>
<ul>
  <li>Location 1 - in the living room, close to the router</li>
  <li>Location 2 - in the office, farther from the router</li>
</ul>

<p>At each location, the client is stationary while measurements are collected.</p>

<h3 id="data-logging">Data logging</h3>
<p>A small data-logging script runs on the MacBook and records data once per second:</p>

<p><strong>Wi-Fi link metrics:</strong></p>
<ul>
  <li>RSSI,</li>
  <li>Noise</li>
  <li>SNR (computed)</li>
  <li>Uplink Tx PHY rate</li>
  <li>Channel</li>
</ul>

<p><strong>Latency metrics:</strong></p>
<ul>
  <li>Ping round-trip time (RTT) to the gateway (LAN)</li>
  <li>Ping RTT to the internet (WAN)</li>
</ul>

<p>These are all client-side measurements. There is no access to AP side data.</p>

<h3 id="ai-assistant-used">AI assistant used</h3>
<p>For the AI assistant, I use an off-the-shelf, pre-trained LLM (gpt-4.1-mini). These models are typically trained on a mixture of publicly available data from the web, licensed data and data created by human trainers.</p>

<h2 id="3-high-level-system-view">3. High-level system view</h2>
<p>The diagram below shows a high level view of the system used in this article.</p>
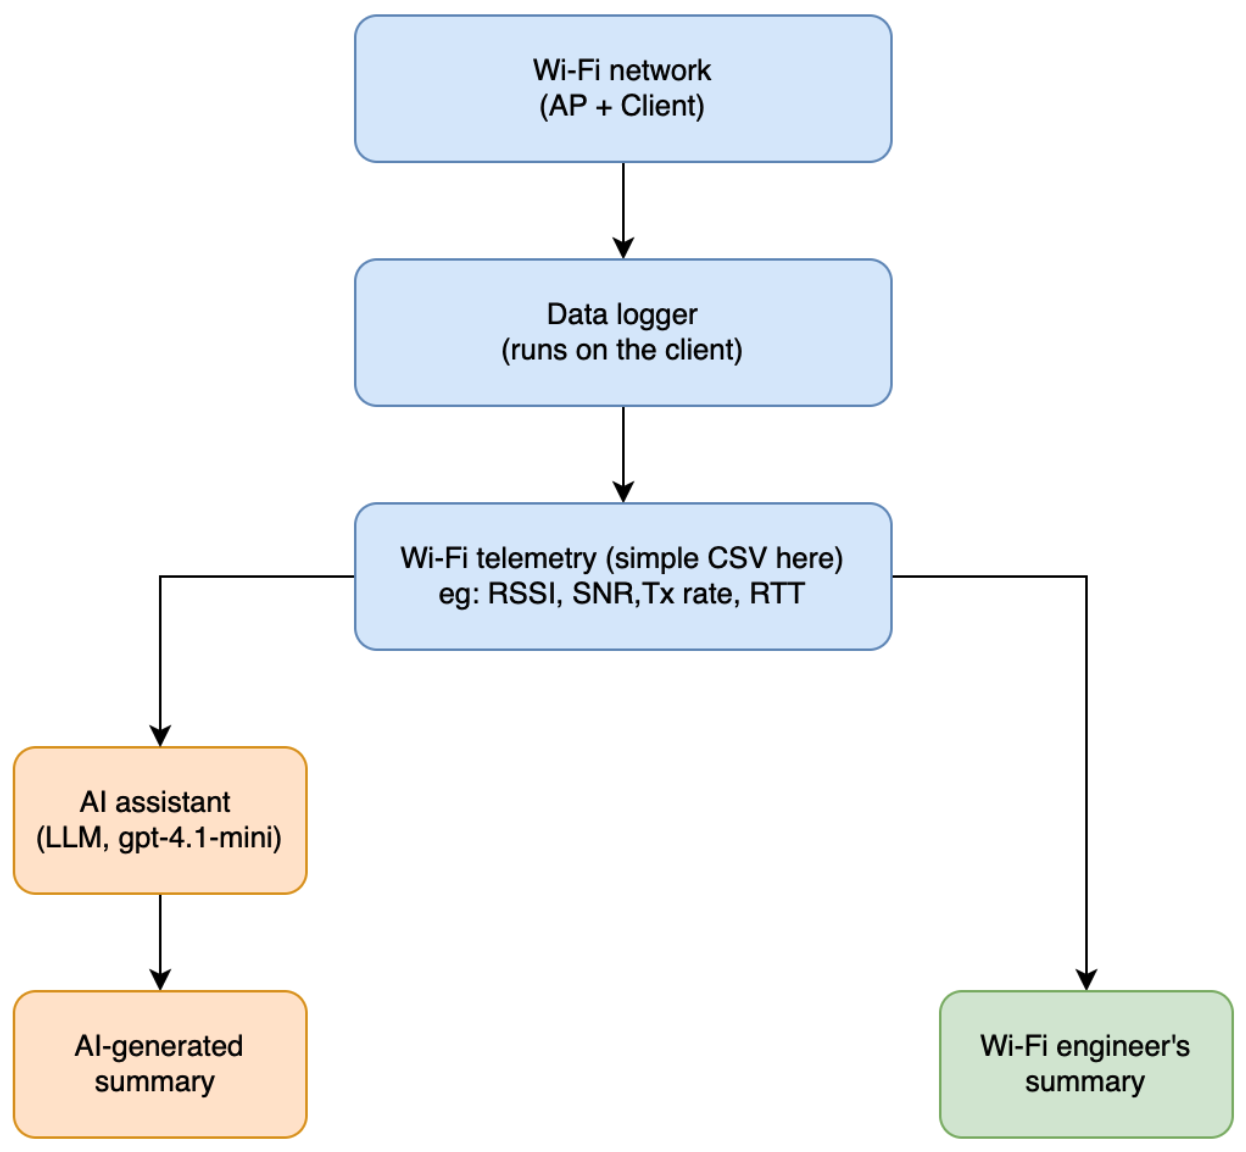
<ul>
  <li>The blue blocks are the common pieces: the Wi-Fi network, a data logger on the client, and a simple telemetry database (a CSV file in this case).</li>
  <li>The green block represents a typical current pattern in organizations, where a Wi-Fi engineer analyzes the field situation using logged data.</li>
  <li>The orange blocks represent an AI assistant (pre-trained LLM) that looks at the same data and produces its own summary.</li>
</ul>

<p><img src="/assets/img/season1-post1/high_level_view.png" alt="High-level system view" width="50%" /></p>

<p>In a production system, a Wi-Fi engineer would usually have access to telemetry from multiple sources captured at different layers (RF, PHY, MAC, network, application), along with firmware and cloud logs when needed.</p>

<h2 id="4-ai-assistant-setup-a-very-basic-helper">4. AI assistant setup: a very basic helper</h2>
<p>For this experiment, the AI assistant receives:</p>
<ul>
  <li>the user complaint text</li>
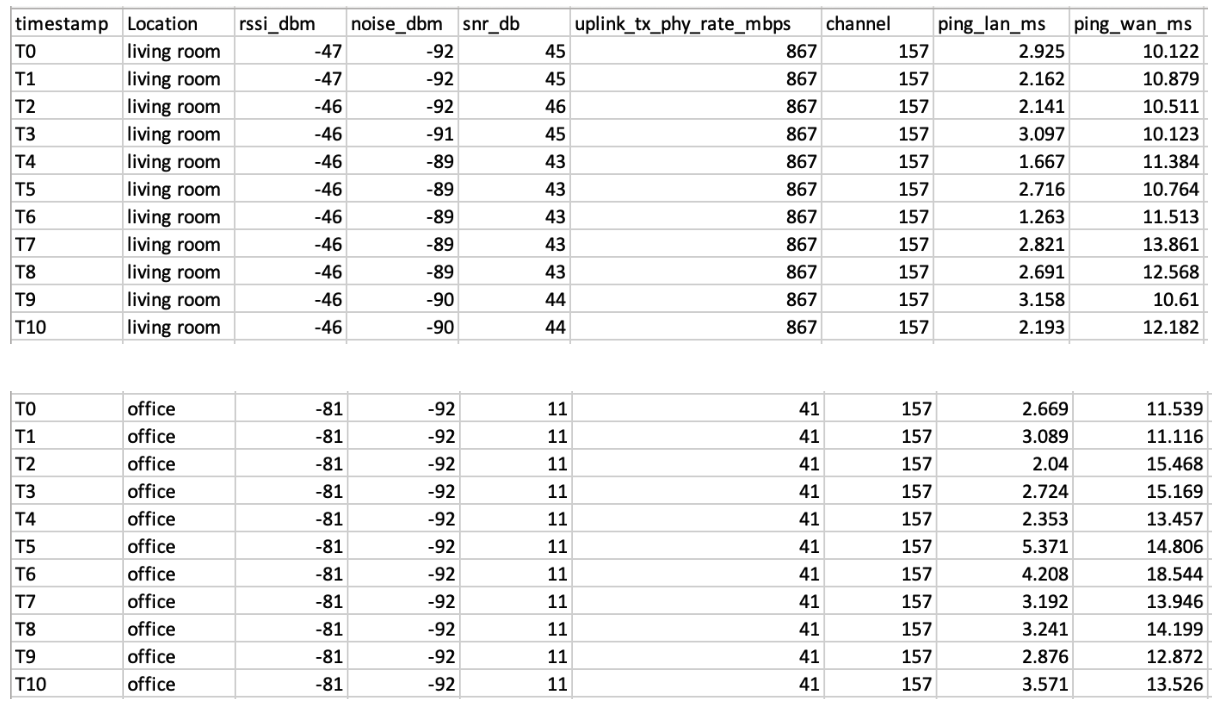
  <li>a time series table of metrics (RSSI, Noise, SNR, uplink Tx PHY rate, channel, LAN/WAN latency) tagged with the location (living room, office), captured from the client only (snapshot below)</li>
</ul>

<p><img src="/assets/img/season1-post1/timeseries_tables.png" alt="time series input to the LLM" width="70%" /></p>

<ul>
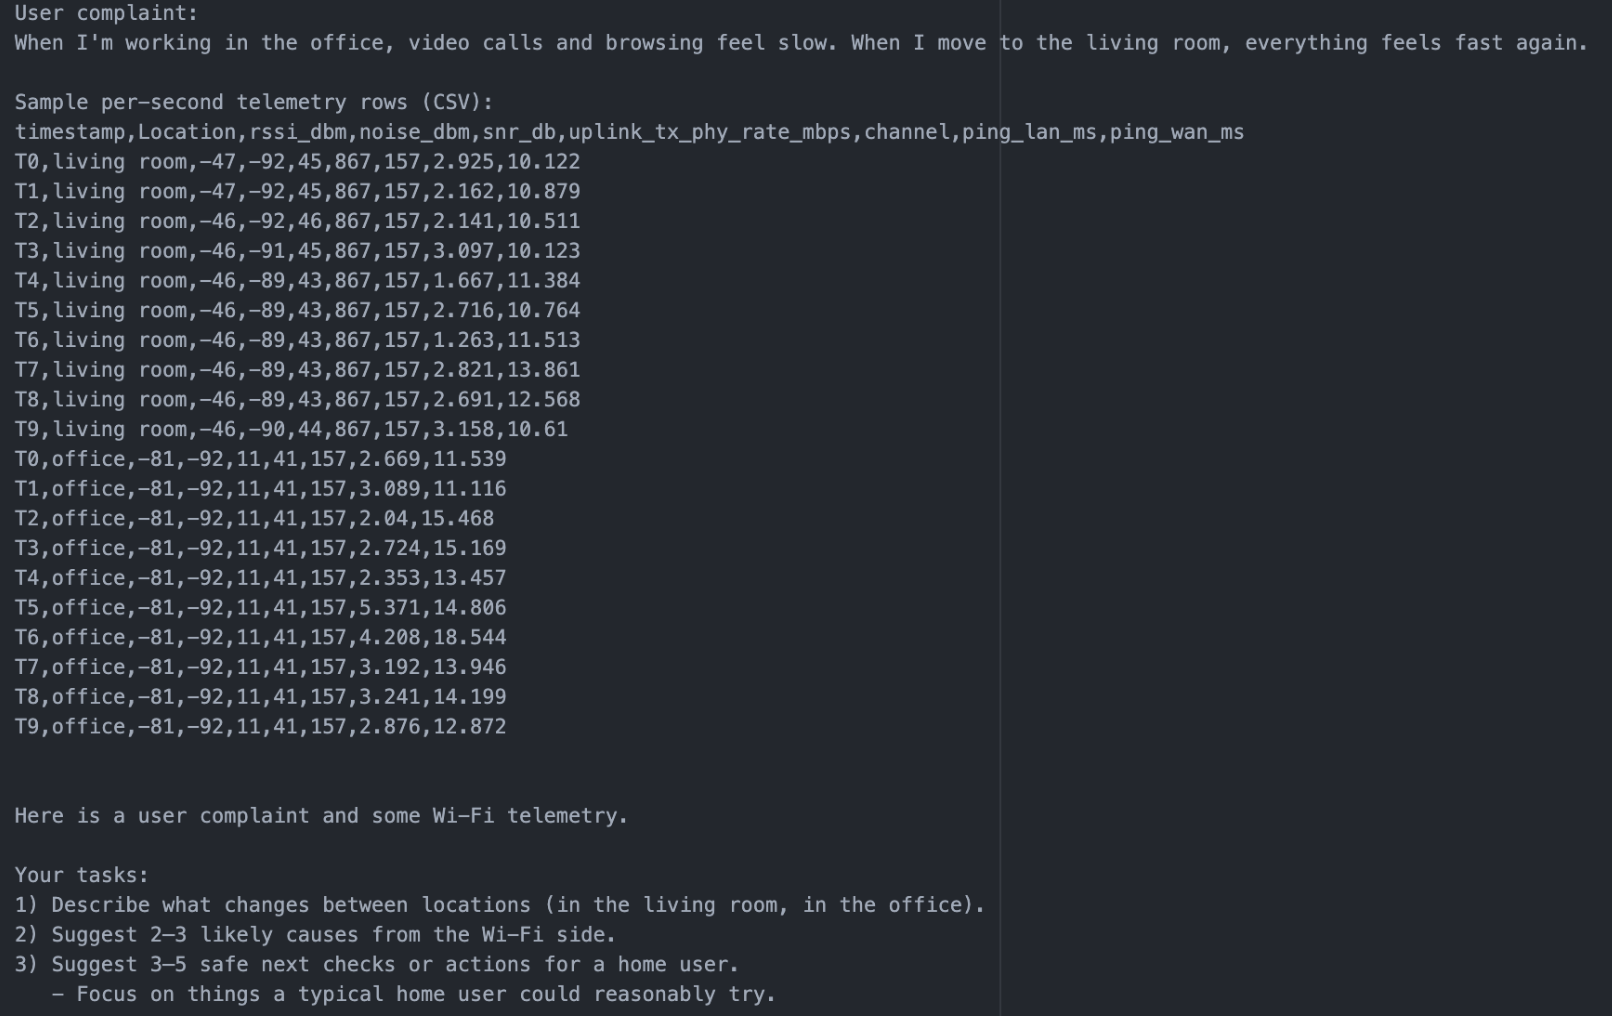
  <li>a simple prompt:</li>
</ul>

<p>“Here is a user complaint and some Wi-Fi telemetry.</p>

<p>Your tasks:</p>

<p>1) Describe what changes between locations (in the living room, in the office).</p>

<p>2) Suggest 2–3 likely causes from the Wi-Fi side.</p>

<p>3) Suggest 3–5 safe next checks or actions for a home user.</p>
<ul>
  <li>Focus on things a typical home user could reasonably try.</li>
</ul>

<p>Be explicit and concise.”</p>

<p><img src="/assets/img/season1-post1/prompts.png" alt="Instructions to the AI assistant" width="85%" /></p>

<h2 id="5-ai-assistants-response-a-closer-look">5. AI assistant’s response: a closer look</h2>
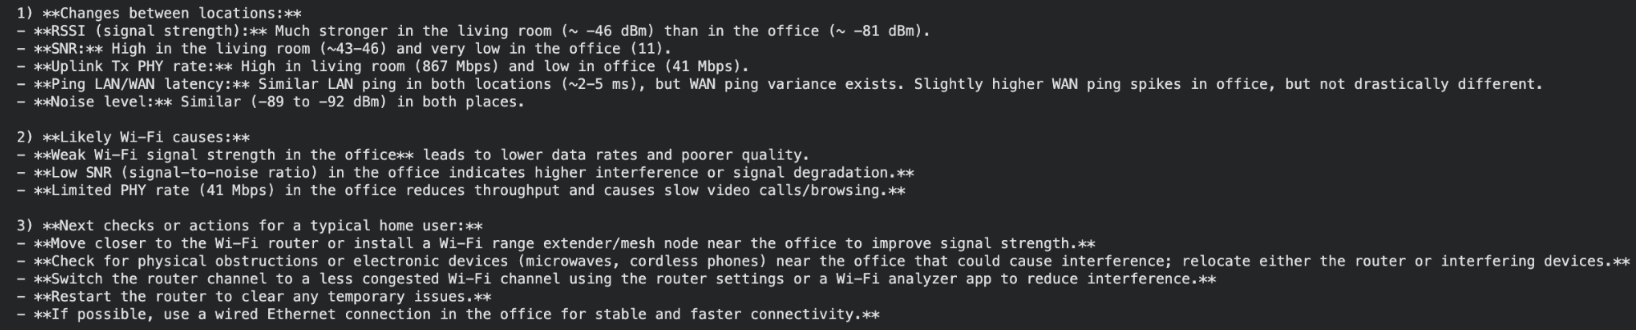
<p>Here’s a snapshot of the summary generated by the LLM:</p>

<p><img src="/assets/img/season1-post1/LLM_response.png" alt="AI assistant's response" width="85%" /></p>

<p><strong>Scrutinizing the ‘observed changes’ and ‘likely causes’:</strong></p>

<p>From this snapshot, the assistant correctly identifies that the RSSI (~ -46 dBm vs ~ -81 dBm), SNR (~ 43-46 dB vs 11 dB) and uplink Tx PHY rate (867 Mbps vs 41 Mbps) are much better in the living room than in the office. It’s good to see that it treats latencies of ~2-5 ms and noise levels of -89 to -92 dBm as those being more <em>similar</em> than different.</p>

<p>It also does a reasonable job of linking the drop in RSSI/SNR in the office to a deterioration in link quality. Interestingly, it also brings up “throughput” even though it was given Tx PHY rate rather than actual throughput measurements.</p>

<p>However, it also adds generic “interference” as a possible cause without any supporting evidence in the data or a clear way to test the hypothesis.</p>

<p><strong>Zooming into the ‘next checks’:</strong></p>

<p>Some of the suggested next steps can serve as reasonable first checks, such as:</p>

<ol>
  <li>
    <p>moving the device closer to the router to see if the signal strength improves,</p>
  </li>
  <li>
    <p>reducing obstacles between router and office and</p>
  </li>
  <li>
    <p>restarting the router as an easy option for the user to try</p>
  </li>
</ol>

<p>But others such as ‘minimize interference’ are too generic and not grounded in facts to show to the end user. Also, advice such as “install a mesh/Wi-Fi range extender” without any context about whether the current Wi-Fi system supports it, or whether an engineer would need to recommend and provision new extender hardware is not realistic. Suggesting the user to use a wired Ethernet connection in the office without understanding the physical limitations such as accessibility can be confusing.</p>

<h2 id="6-analysis-strengths-and-weaknesses">6. Analysis: strengths and weaknesses</h2>
<p>In this simple setup, the very basic AI assistant is still useful to:</p>
<ul>
  <li>notice general trends (for example, “signal strength in the office is worse than in the living room”)</li>
  <li>suggest a few reasonable, simple next steps</li>
</ul>

<p>However, it clearly falls short in other ways:</p>
<ul>
  <li>It doesn’t clearly distinguish between different root causes (coverage vs interference).</li>
  <li>It provides generic advice that also seems impractical as one of the first lines of action, such as addition of an extender, without considering user or system constraints.</li>
  <li>It shows no awareness of missing data that would help disambiguate between different causes (for example, use of channel utilization or retry rates to infer interference).</li>
</ul>

<p>So, the basic assistant is directionally helpful but not sufficient on its own. For this specific example, a simple heuristic such as nudging the user to move close to the router when the RSSI is very low would be already good enough. Using a LLM helps illustrate the model’s behavior in a simple setting when it is presented with real telemetry data. In future articles, we will explore different ways to make these kinds of systems more useful.</p>

<h2 id="7-conclusion">7. Conclusion</h2>
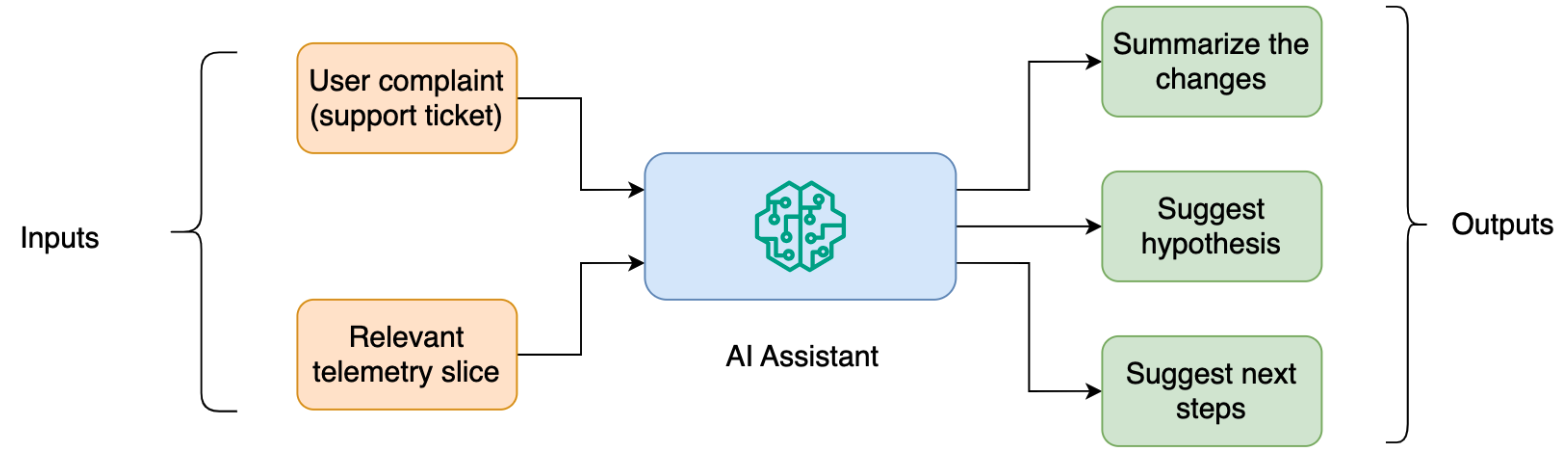
<p>Conceptually, a high level view of this workflow could look like the image below. Real deployments would include the data infrastructure and orchestration around it.</p>

<p><img src="/assets/img/season1-post1/conclusion_image.png" alt="Real system workflow" width="70%" /></p>

<p>Even for this simple incident, a production workflow would need more structure around the assistant’s outputs. Some suggestions are actionable for the end user (for example, moving the device), while others are more technical and require due diligence before recommending to the end user (for example, adding an extender).</p>

<p>Overall, this justifies exploring LLM capabilities to augment the current support workflow, especially for capturing patterns in telemetry and turning them into structured hypotheses. If you are thinking about how to choose the right Wi-Fi telemetry, how to judge whether LLM responses are strong enough, or how to bring AI into your managed connectivity system for Wi-Fi use cases, feel free to reach out.</p>

<h2 id="8-appendix">8. Appendix</h2>

<h3 id="data-collection-details">Data collection details</h3>
<ul>
  <li>Client device: MacBook (macOS 12.7.4)</li>
  <li>Access point: retail dual-band Wi-Fi 5 router (2.4 GHz/5 GHz)</li>
  <li>Sampling interval: 1 sample per second</li>
</ul>

<p><strong>Capture durations:</strong></p>
<ul>
  <li>Living room: 2 minutes</li>
  <li>Office: 2 minutes</li>
</ul>

<p><strong>Wi-Fi metrics (RSSI, noise, Tx PHY rate)</strong></p>
<ul>
  <li>On macOS, the airport utility was used to collect Wi-Fi metrics
    <div class="language-bash highlighter-rouge"><div class="highlight"><pre class="highlight"><code>/System/Library/PrivateFrameworks/Apple80211.framework/Versions/Current/Resources/airport <span class="nt">-I</span>
</code></pre></div>    </div>
  </li>
</ul>

<p><strong>Round-trip time</strong></p>

<ul>
  <li>LAN round-trip time (gateway ping)
    <div class="language-bash highlighter-rouge"><div class="highlight"><pre class="highlight"><code>ping <span class="nt">-c</span> 1 <span class="nt">-W</span> 1000 &lt;gateway_ip&gt; 
</code></pre></div>    </div>
  </li>
  <li>WAN round-trip time (internet ping)
    <div class="language-bash highlighter-rouge"><div class="highlight"><pre class="highlight"><code>ping <span class="nt">-c</span> 1 <span class="nt">-W</span> 1000 &lt;wan_host&gt;
</code></pre></div>    </div>
  </li>
</ul>

<p><strong>Sequence of actions</strong></p>

<p>Every second, a script executed the following sequence of actions:</p>
<ul>
  <li>ran the following command:
    <div class="language-bash highlighter-rouge"><div class="highlight"><pre class="highlight"><code>airport <span class="nt">-I</span>
</code></pre></div>    </div>
  </li>
  <li>ran one LAN ping and one WAN ping, and</li>
  <li>parsed the outputs (RSSI, noise, Tx PHY rate, LAN RTT, WAN RTT), computed the SNR and logged along with a timestamp, and location tag (living room, office) into a CSV file.</li>
</ul>

<h3 id="recording-llm-response">Recording LLM response</h3>
<ul>
  <li>LLM response was obtained using the following API from OpenAI:</li>
</ul>

<div class="language-python highlighter-rouge"><div class="highlight"><pre class="highlight"><code><span class="n">response</span> <span class="o">=</span> <span class="n">client</span><span class="p">.</span><span class="n">responses</span><span class="p">.</span><span class="nf">create</span><span class="p">(</span>
    <span class="n">model</span><span class="o">=</span><span class="sh">"</span><span class="s">gpt-4.1-mini</span><span class="sh">"</span><span class="p">,</span> 
    <span class="nb">input</span><span class="o">=</span><span class="p">[</span>
        <span class="p">{</span>
            <span class="sh">"</span><span class="s">role</span><span class="sh">"</span><span class="p">:</span> <span class="sh">"</span><span class="s">user</span><span class="sh">"</span><span class="p">,</span>
            <span class="sh">"</span><span class="s">content</span><span class="sh">"</span><span class="p">:</span> <span class="n">input_prompt</span><span class="p">,</span>
        <span class="p">}</span>
    <span class="p">],</span>
<span class="p">)</span>

<span class="n">answer</span> <span class="o">=</span> <span class="n">response</span><span class="p">.</span><span class="n">output</span><span class="p">[</span><span class="mi">0</span><span class="p">].</span><span class="n">content</span><span class="p">[</span><span class="mi">0</span><span class="p">].</span><span class="n">text</span>
</code></pre></div></div>]]></content><author><name></name></author><category term="blog" /><category term="wifi" /><category term="ai" /><category term="llm" /><category term="support" /><summary type="html"><![CDATA[Sifting Signals: commentary on using data to reason about Wi-Fi behavior and use cases at scale, whether you are designing features, tuning performance, or debugging issues.]]></summary></entry></feed>